

Date: Sat, February 8, 2025 | 12:22 PM GMT
In the cryptocurrency market, major altcoins have been struggling to hold their ground since the November rally. Many altcoins have undergone a steep correction, largely influenced by the rapid rise in BTC dominance, which continues to add bearish pressure.
Among the hardest-hit altcoins are Thorchain (RUNE) and Oasis (ROSE), both of which have experienced substantial drops of 80% and 62%, respectively, in the past 60 days. Now, they are at a critical juncture, testing key support levels.
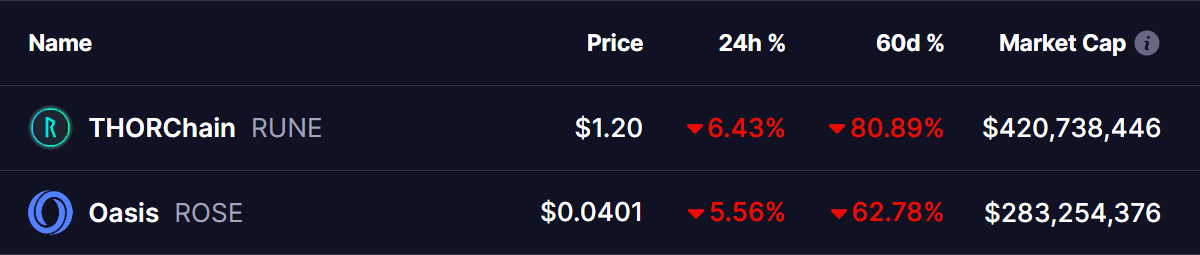 Source: Coinmarketcap
Thorchain (RUNE)
The monthly chart for Thorchain (RUNE) shows that the price has been consolidating within a three-year-long descending triangle pattern. The recent downtrend, which began on December 2, was triggered by a rejection from the upper resistance of the triangle at $7.58 after news of the protocol’s mounting debts .
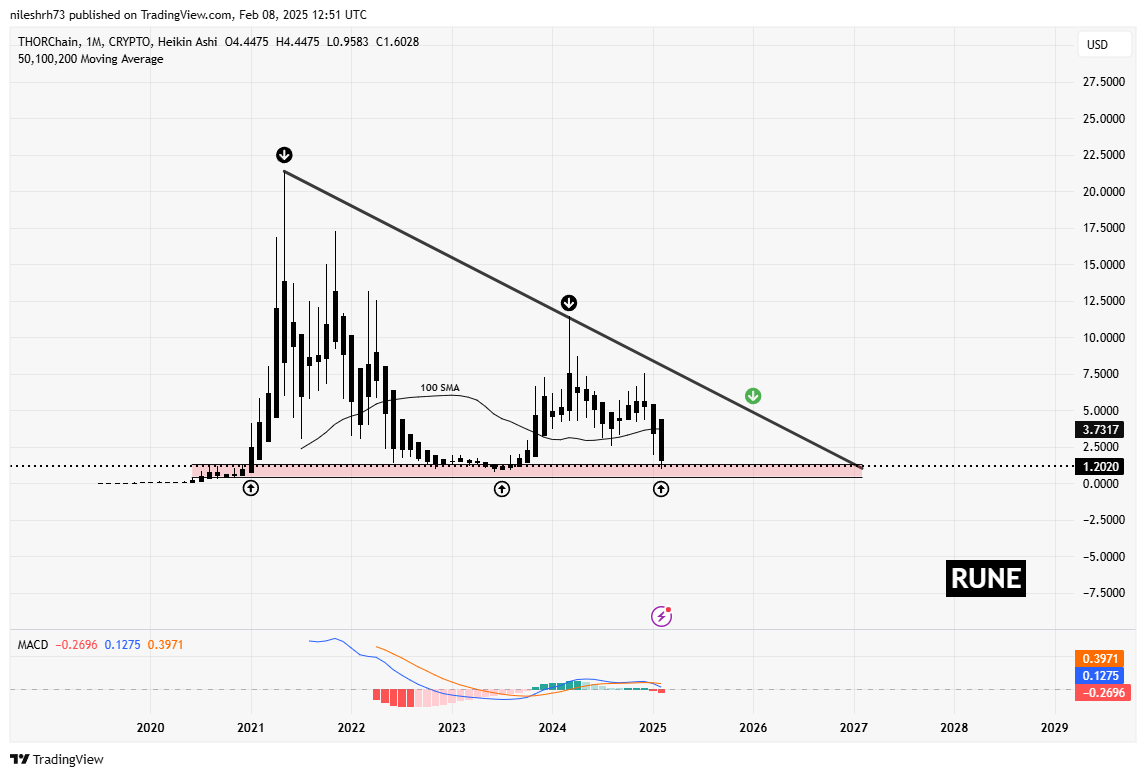 Thorchain (RUNE) Monthly Chart/Coinsprobe (Source: Tradingview)
This decline brought RUNE to a major support zone, hitting a low of $0.95. However, the price has managed to hold and is now trading around $1.19.
Historically, this level has acted as a strong rebound zone, and if the pattern follows previous trends, RUNE may challenge the 100-day SMA as a key resistance. A breakout above this moving average could open the doors for a retest of the descending trendline.
Oasis (ROSE)
The weekly chart for Oasis (ROSE) shows consolidation within a descending triangle pattern. The recent downtrend, which started on December 2, was triggered by a rejection at the upper resistance trendline around $0.14.
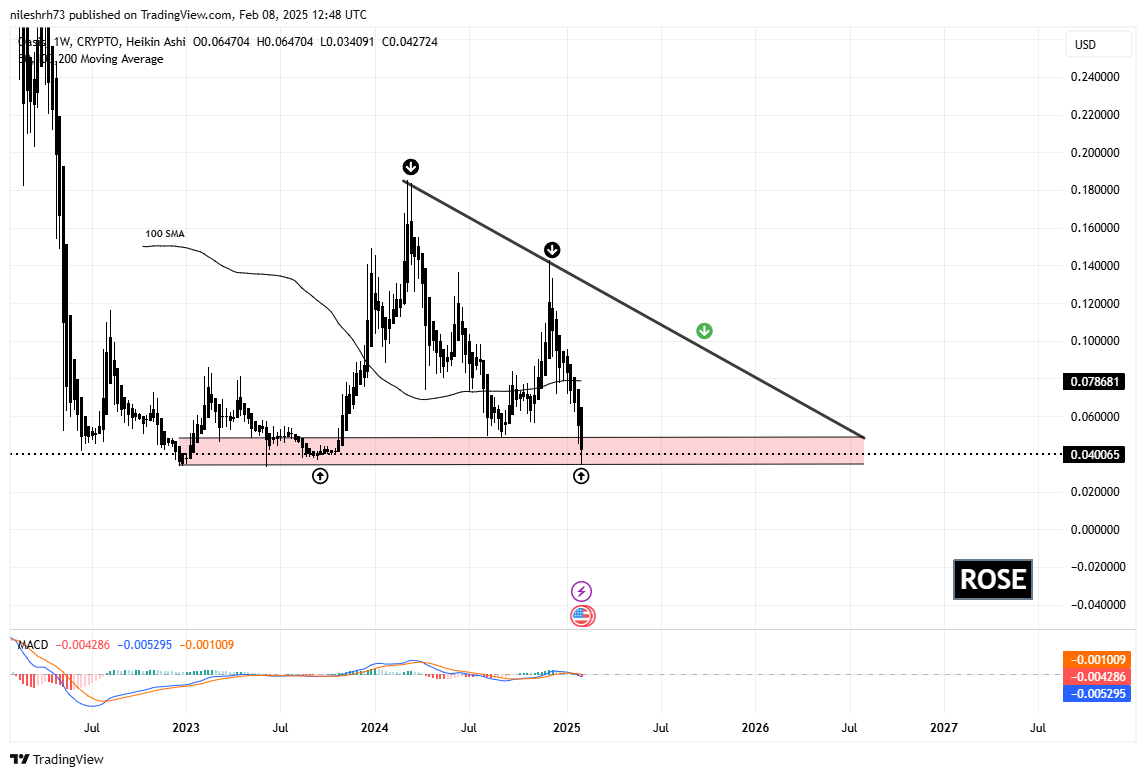 Oasis (ROSE) Weekly Chart/Coinsprobe (Source: Tradingview)
This decline brought ROSE to a major support zone, hitting a low of $0.034. However, the price has managed to hold and is now trading around $0.040.
Previously, this level has acted as a strong rebound zone, and if the pattern follows previous trends, ROSE may challenge the 100-day SMA as a key resistance. A breakout above this moving average could open the doors for a retest of the descending trendline.
Is a Bounce Back Ahead?
Both RUNE and ROSE are showing resilience at their key support levels. Their next moves will largely depend on Ethereum (ETH), which is currently trading at $2,600, and the broader crypto market sentiment. If ETH continues its recovery, it could provide the momentum needed for altcoins like RUNE and ROSE to confirm a breakout and start a new bullish trend.
The MACD on both charts is bearish but showing signs of weakening momentum, indicating a potential reversal if a bullish crossover occurs. If buyers step in at these critical levels, both RUNE and ROSE could see a strong bounce in the coming weeks.
Investors should keep a close eye on these support levels, as a break below could trigger further downside, while a confirmed bounce could present an attractive entry point for long-term gains.
Disclaimer: This article is for informational purposes only and not financial advice. Always conduct your own research before investing in cryptocurrencies.


