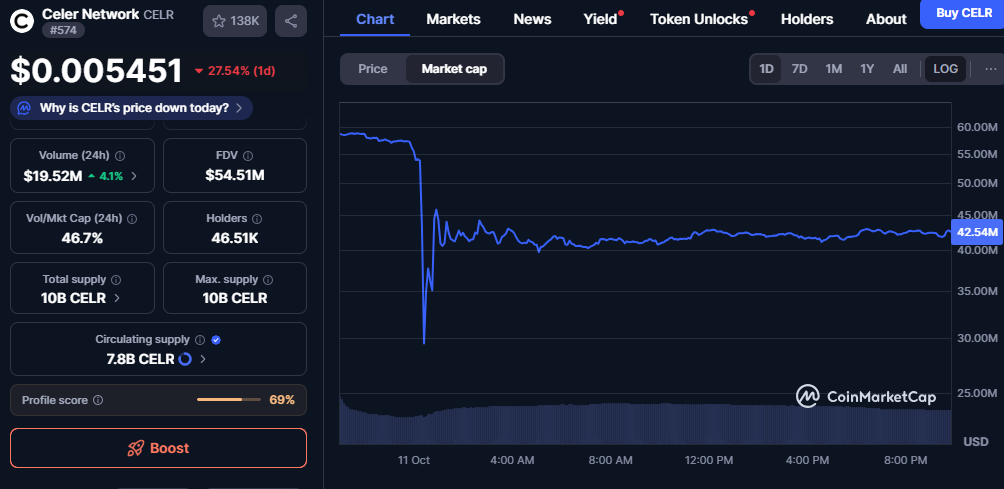
- A 27.5% drop ended in a flat balance zone as volume stayed firm and V/M cap hit ~47%.
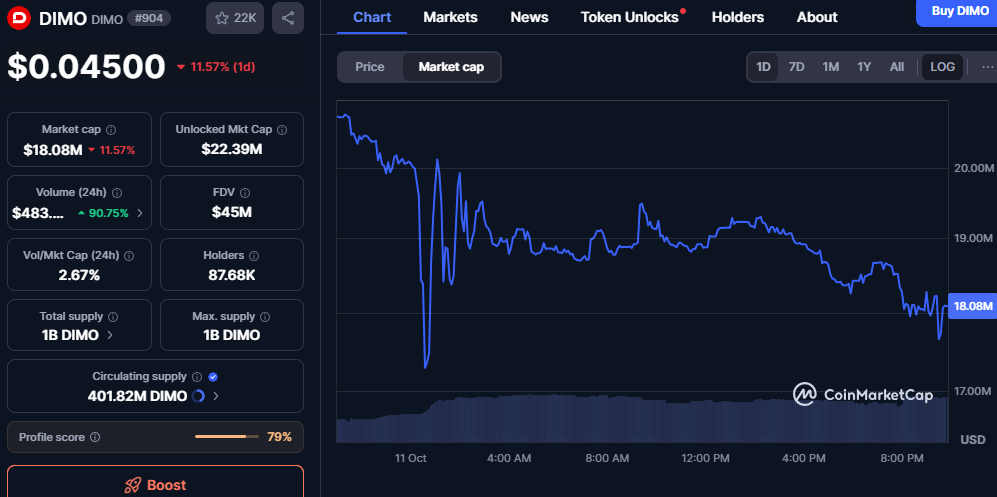
- DIMO Weak rebounds and thin liquidity keep bias down unless $0.043–$0.046 holds and builds higher lows.
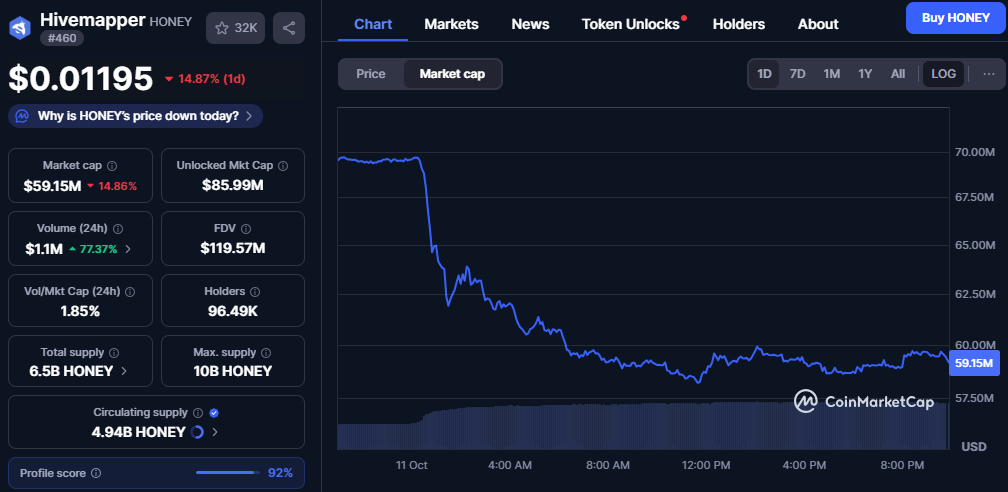
- Post-gap trade forms a band near $59M cap; steadier volume and tighter ranges are required.
Market breadth narrowed while several small-cap tokens printed decisive technical shifts. CELR reset after a vertical shock, DIMO weakened despite higher activity, and HONEY steadied. These moves set near-term roadmaps defined by liquidity, supply profiles, and volume behavior.
Celer Network (CELR): Shock Drop, High Turnover, Flat Balance
CELR fell about 27.5% to roughly $0.00545 during the session. Market cap plunged intraday and then stabilized near $42.5 million. Volume still rose around 4% to $19.5 million, which signaled firm participation into weakness.
Source: CoinMarketcap
The volume-to-market-cap ratio printed near 47%, indicating heavy two-sided trade and rapid turnover. Circulating supply stands around 7.88 billion from a 10 billion maximum. With FDV near $54.5 million, the valuation gap to market cap remains narrow.
Price structure showed a vertical cap drop transitioning into a flat consolidation band. Such bands often mark short-term equilibrium as new information is absorbed. Continuation or recovery will depend on whether renewed volume supports a grind higher.
DIMO (DIMO): Trend-Day Weakness, Thin Liquidity, Base Needed
DIMO traded near $0.045 after an intraday decline of roughly 11.6%. Market cap hovered around $18.1 million by the close. The chart displayed an early slide, a long wick, and persistent lower highs.
Source: CoinMarketcap
Daily volume jumped about 91% to roughly $483,000, reflecting heightened activity during the decline. Yet the volume-to-market-cap ratio sat near 2.7%, suggesting thinner liquidity than peers. Circulating supply reached about 401.8 million out of a 1 billion cap.
FDV stands close to $45 million, so meaningful future issuance remains possible. Unlocked market cap exceeds spot market cap, allowing additional float over time. Consequently, rallies may meet supply until structure improves.
Price action still respected a descending intraday trend through the afternoon. A constructive base would require stabilization around $0.043 to $0.046 with higher lows. Without that build, sideways to down remains the path of least resistance.
Hivemapper (HONEY): Gap Down, Participation Rise, Stabilization Band
HONEY traded near $0.01195, down roughly 14.9% on the day. Market cap settled around $59.15 million after early weakness. Volume advanced about 77% to roughly $1.1 million, which signaled engagement throughout the drop.
Source: CoinMarketcap
The volume-to-market-cap ratio printed near 1.85%, modest yet higher than recent sessions. Circulating supply stands near 4.94 billion of 10 billion total. FDV approximates $119.6 million, leaving a substantial future supply component.
Unlocked market cap exceeds spot market cap, suggesting room for more circulating tokens. The market-cap curve showed a shallow recovery into the close. However, confirmation still requires steadier volume and a tighter trading range.
Near term, the tape suggests a stabilization band around the $59 million market-cap area. Sustained improvement would feature higher lows and a gently rising cap curve. Otherwise, the early gap may invite retests before a durable base forms.
Across these names, liquidity and issuance structure shaped outcomes as much as sentiment. CELR exhibited rapid balance after heavy turnover, while DIMO weakened under thin liquidity. HONEY presented early stabilization but still needs structured confirmation.